LLM observability for AI engineers: what to implement first
LLM observability is the practice of instrumenting, tracing, and evaluating large language model systems so that semantic behaviour — not just infrastructure health — becomes measurable and improvable in production. The single most important action your team can take right now is to capture end-to-end traces with token-level metadata using OpenTelemetry, covering every step from user input through retrieval, prompt assembly, and generation. The sections below map the core pillars, the metrics that matter, and the validation tests that prove your setup actually works.
Table of Contents
What is LLM observability and why does it differ from traditional monitoring?
What are the core pillars and key metrics of LLM observability?
How do you instrument an LLM pipeline and close the production→development loop?
How do you validate that your observability setup actually works?
When should you build observability in-house versus hiring managed AI operations?
Sentient Concepts accelerates observability adoption for enterprise AI teams
What is LLM observability and why does it differ from traditional monitoring?
Traditional observability measures whether a system is up, fast, and error-free. For large language model applications, those signals are necessary but nowhere near sufficient. An HTTP 200 response tells you the model replied; it tells you nothing about whether that reply was factually correct, contextually relevant, or safe to surface to a user.
LLM observability extends instrumentation, tracing, and evaluation to cover semantic behaviour: what the model said, why it said it, and whether that output meets defined quality standards. Semantic observability uses secondary AI models to score content flowing through the system for hallucination, toxicity, and relevance — signals that no infrastructure metric can produce.

Three structural differences make large language model monitoring genuinely distinct.
Non-determinism. The same prompt can produce different outputs across runs, which means regression testing requires statistical sampling rather than exact-match assertions.
Semantic failure modes. A model can return a confident, well-formed answer that is factually wrong. Latency and error-rate dashboards will show green; your users will receive misinformation.
RAG and agentic complexity. Retrieval-Augmented Generation pipelines introduce retrieval steps, re-ranking, and context injection before generation even begins. Agentic systems add tool calls, multi-step reasoning, and external API interactions. Without span-level context linking the full execution chain, isolating the causal span in an agentic failure is infeasible.
Consider a concrete example. A RAG-based document assistant returns an answer that contradicts the source document. A trace that captures the retrieval span — including the documents returned, their similarity scores, and the assembled prompt — reveals immediately whether the retrieval step fetched the wrong chunk or whether the model ignored a correctly retrieved passage. Without that trace, the debugging process is guesswork.
For engineering teams, the practical case for investing in LLM observability comes down to four outcomes:
Faster root-cause analysis: span-level traces reduce mean time to identify (MTTI) from hours to minutes when a failure is reproducible.
Cost control: token usage and cost-per-query metrics surface runaway prompt templates before they compound on the operational budget.
Safety and factuality monitoring: automated hallucination and toxicity scoring catches quality regressions before they reach end users at scale.
Regression control: continuous evaluation pipelines gate deployments on quality metrics, preventing prompt or model changes from silently degrading production behaviour.
What are the core pillars and key metrics of LLM observability?
Effective large language model monitoring rests on five pillars. Each maps to a distinct class of signals, and each requires different instrumentation.
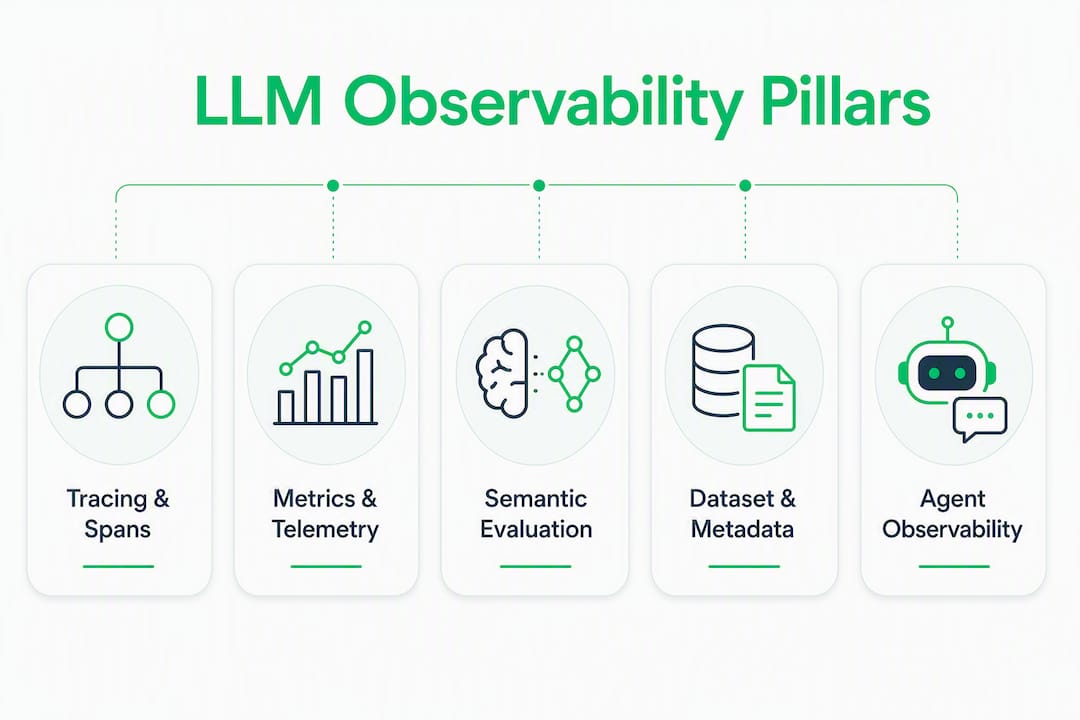
Pillar | Representative metrics | Alert example |
Tracing and spans | End-to-end latency, span duration per step, retrieval latency | P95 latency exceeds threshold; retrieval span significantly exceeds typical baseline duration |
Metrics and telemetry | Tokens per query, cost per query, throughput (queries/sec), error rate | Token spikes significantly above normal levels; cost-per-query anomalies |
Semantic evaluation | Hallucination rate, answer relevance, faithfulness to source, toxicity score | Hallucination score rises above defined threshold on a prompt template |
Dataset and metadata management | Eval dataset coverage, prompt version, model name/version, sampling parameters | Prompt version mismatch in production vs. staging |
Agent observability | Tool call success rate, intermediate decision accuracy, loop count, external API latency | Tool call failure rate exceeds tolerance; unexpected loop count |
Tracing and spans form the foundation. Every request should produce a root span covering the full lifecycle, with child spans for each discrete step: retrieval, re-ranking, prompt assembly, model call, and any tool invocations. Each span should record its own latency, input/output payloads, and error state.
Metrics and telemetry covers the computational signals. Token counts and cost-per-query are particularly important for production systems where prompt template changes can silently multiply spend. Auto-instrumentation via OpenTelemetry extensions such as OpenLIT and OpenLLMetry can capture latency, errors, and token usage without manual code changes in many framework-integrated setups.
Semantic evaluation is where LLM observability diverges most sharply from traditional APM. Auxiliary models score outputs for hallucination, toxicity, and relevance — metrics that cannot be derived from infrastructure signals. For RAG systems specifically, the RAG triad provides a structured evaluation framework: retrieval recall and precision (did the system fetch the right documents?), context relevance (were the retrieved documents actually useful for the query?), and faithfulness (does the generated answer accurately reflect the retrieved content?). When a RAG system fails, traces let you inspect retrieval spans and generation spans side by side to isolate which component introduced the error.
Dataset and metadata management tracks prompt versions, model versions, and sampling parameters alongside every trace. Without this, correlating a quality regression with a specific prompt change becomes extremely difficult.
Agent observability addresses the additional complexity of multi-step agentic workloads. Tool call success rates, loop counts, and intermediate decision logs are all necessary to debug non-deterministic agentic behaviour. Splunk’s guidance on LLM monitoring reinforces the need to combine objective metrics such as perplexity and factuality scores with subjective user-experience signals including session length and repeat query rates.
What should you look for in an LLM observability tool?
The single most important capability is full-chain trace visibility: the ability to link user input through retrieval, prompt assembly, generation, and tool calls in a single, navigable trace. Everything else is secondary to that.
Datadog defines LLM observability as continuous visibility into inputs, outputs, traces, token usage, and model behaviour, with chain debugging, full-stack visibility, and built-in evaluations for hallucination detection and prompt injection. That definition is a reasonable baseline for any evaluation.
Beyond the baseline, the dimensions that most affect engineering outcomes are:
Evaluation depth. Does the platform include native LLM-as-judge evaluation, or does it require you to wire up your own scoring pipeline? Platforms with built-in eval frameworks and dataset management reduce the time to close the production→development loop considerably.
Tracing granularity. Can you inspect individual agentic steps, tool calls, and retrieval spans? General APM platforms are adding LLM features, but they often lack deep agentic debugging and native evaluation frameworks found in specialised LLM observability platforms. A unified APM view is convenient; it is not a substitute for step-level agentic visibility when debugging complex pipelines.
Integration with open standards. Prioritise platforms that export OTLP traces to standard backends such as Prometheus, Grafana, Jaeger, or Datadog. This avoids vendor lock-in and allows you to reuse existing infrastructure. OpenTelemetry compatibility is the clearest signal that a platform is built for longevity.
Alerting and workflow integrations. Production systems need alerts that reach engineers where they work. PagerDuty, Slack, and Microsoft Teams integrations are table stakes; the more important question is whether alerts can be scoped to semantic thresholds (hallucination rate, faithfulness score) rather than only infrastructure metrics.
Deployment model and data residency. For UK enterprise teams, this is often the deciding factor. SaaS platforms offer faster time to value; on-premises or private cloud deployments are required when prompts and outputs contain personally identifiable information or commercially sensitive content subject to UK GDPR. Confirm where trace data is stored and processed before committing to any platform.
Cost transparency and token accounting. The platform should attribute token usage and cost to individual prompt templates, users, or business units. Without this granularity, cost optimisation is reactive rather than systematic.
Collaboration and non-engineer access. Product managers, QA analysts, and domain subject matter experts need to review traces and evaluation results without writing code. Platforms that restrict access to engineers slow down the feedback loop that makes observability valuable.
When evaluating vendors or scoping an internal build, run these questions directly: Consider leveraging a no-code trading algorithm platform to simplify integration and accelerate development.
Can you export OTLP traces to our existing backend?
How do you evaluate hallucinations — which judge model, and how is it calibrated?
Can non-engineers run evaluations and review flagged traces?
What is the data residency model, and is UK or EU storage available?
How does the platform handle prompt versioning and dataset curation?
What is the pricing model — per token, per trace, or per seat?
The trade-off between a unified APM platform and a specialised LLM observability stack is real. Unified platforms reduce procurement complexity and consolidate dashboards; specialised platforms provide deeper eval management, prompt playgrounds, and agentic step visibility. For teams running simple chat applications, a general APM with LLM extensions may suffice. For agentic workloads or RAG pipelines where semantic quality is business-critical, a specialised stack is worth the additional procurement effort.
How do you instrument an LLM pipeline and close the production→development loop?
Start by capturing end-to-end traces with semantic scores and full metadata. The recommended pipeline runs: auto-instrumentation via OpenTelemetry → OTLP collector → persistent trace store → evaluation runners → dataset curation → CI-gated eval pipelines.
What to capture at each span
At every span in the execution chain, record the following:
User input span: raw query text, session ID, user segment or role, timestamp.
Retrieval span: query embedding, documents returned with similarity scores and source metadata, re-ranking scores if applicable.
Prompt assembly span: final prompt text, template version, injected context length, token count.
Generation span: model name and version, sampling parameters (temperature, top-p), input and output token counts, cost, raw output text, latency.
Tool call spans: tool name, input arguments, output payload, latency, success or error state.
Human feedback: thumbs up/down, correction flags, escalation events — linked back to the originating trace ID.
OpenLLMetry and OpenLIT provide open-source instrumentations for LLM provider APIs and vector databases that export OTLP traces to existing backends, enabling reproducible proof-of-concept deployments without vendor lock-in.
Storage and retention
For real-time dashboards and alerting, route metrics to Prometheus with Grafana for visualisation. For trace storage, Jaeger or a compatible OTLP backend handles short-to-medium retention. For long-term eval datasets, export traces to object storage (AWS S3, Azure Blob, or on-premises equivalents) in a structured format that evaluation runners can query. The cost trade-off is straightforward: high-frequency metrics are cheap to store; full prompt and output payloads accumulate quickly, so apply retention policies based on business need and data classification.
Closing the production→development loop
Treating observability as only a dashboarding exercise is the most common pitfall. The value accrues when failed production traces are automatically curated into test datasets and fed back into evaluation and prompt improvement cycles. The operational pattern looks like this:
Automated labelling flags traces that breach quality thresholds (hallucination score, low faithfulness, user correction events). Those traces are routed to a curated eval dataset. Evaluation runners score new prompt versions against that dataset. CI pipelines gate deployments on eval results, blocking releases that regress on defined metrics.
Pro Tip: Instrument a single high-value use case first rather than attempting full-pipeline coverage immediately. A focused PoC on one prompt template or one RAG retrieval step will surface instrumentation gaps and calibration issues before they multiply across the whole system.
Specialist platforms support this loop natively with dataset management, LLM-as-judge features, and prompt management playgrounds that let teams test prompt versions against curated datasets before deployment. For teams building on open standards, the same loop is achievable with OpenTelemetry, a trace store, and an evaluation framework such as TruLens.
A note on automated evaluation: LLM-as-judge pipelines need continuous calibration with human benchmarks because judge models can drift and introduce bias over time. Schedule periodic human review sessions to validate that automated scores remain aligned with domain expert judgement.
How do you validate that your observability setup actually works?
Define measurable acceptance criteria before you run a single test. Three concrete examples: the setup must detect an injected hallucination within five minutes of occurrence; it must reproduce a retrieval failure and trace it to the specific retrieval span; it must surface a cost anomaly when token usage spikes beyond a defined threshold.
With acceptance criteria in place, run the following test plan:
Synthetic trace injection: generate known-bad traces (fabricated answers, wrong document citations, malformed tool outputs) and confirm the evaluation pipeline flags them correctly within the defined detection window.
Retrieval failure injection: deliberately misconfigure the vector database query to return irrelevant documents and verify that retrieval precision metrics drop and an alert fires.
Tool call failure injection: simulate an external API timeout or error response and confirm the tool call span records the failure state and that the root-cause trace is navigable.
Drift detection test: introduce a gradual shift in prompt template wording across a batch of synthetic queries and confirm that semantic quality metrics detect the regression before it reaches a defined severity threshold.
End-to-end latency and cost scenario: run a load test at expected production query volume and verify that per-query cost and P95 latency metrics are accurate and that alerts fire at the correct thresholds.
Success metrics for a PoC validation should include: detection window for injected failures, false positive rate on semantic alerts, ability to trace any flagged output to its causal span, and measurable reduction in MTTI compared to the pre-observability baseline.
For ROI measurement, instrument a single use case through a complete improvement cycle: identify a recurring failure pattern from production traces, fix the prompt or retrieval configuration, re-run evals against the curated dataset, and measure the before-and-after quality scores alongside any change in cost-per-query. That closed loop, documented with trace evidence, is the clearest demonstration of observability value to engineering leadership and commercial stakeholders.
When should you build observability in-house versus hiring managed AI operations?
Build in-house when you need deep, bespoke visibility into proprietary pipelines and have the engineering capacity to maintain instrumentation, calibrate eval models, and operate the production→development loop continuously. Choose managed AI operations when you need speed to production, defined SLAs, and access to practitioners who have already solved the instrumentation and eval calibration problems you are about to encounter.
The decision is rarely binary. Most enterprise teams benefit from a hybrid: open-standard instrumentation owned internally, with a managed partner operating the evaluation pipelines, runbooks, and continuous improvement cycles.
A practical decision matrix:
Scale and complexity. Simple chat applications with a single model call are tractable to instrument internally. Agentic workloads with multi-step reasoning, tool calls, and RAG pipelines introduce enough complexity that relying on black-box vendor tools limits visibility; architects should prioritise systems that provide full-chain visibility. Managing that at scale requires dedicated operational capacity.
Compliance and data residency. UK enterprise teams operating under UK GDPR must confirm that prompts, outputs, and trace data containing PII are processed and stored within approved jurisdictions. On-premises or UK-hosted private cloud deployments are often required for financial services, insurance, and public sector workloads. A managed partner with demonstrable UK data residency options and experience with AI security controls reduces the compliance burden considerably.
Team capacity. Observability maintenance is not a one-time setup. Eval models drift, prompt templates change, and new failure modes emerge as usage patterns evolve. If your ML engineering team is already at capacity on model development, the operational overhead of maintaining a continuous eval pipeline will be deprioritised — and the production→development loop will break down.
Speed to value. A managed partner can typically instrument a production pipeline and establish baseline quality metrics within weeks rather than months. For teams under commercial pressure to demonstrate AI ROI, that acceleration matters.
Pro Tip: The production→development loop is the costliest omission in most enterprise LLM programmes. Teams that instrument traces but never close the loop back into prompt improvement and CI-gated evals are paying for observability without extracting its value. A managed operator who owns that loop end-to-end typically delivers faster quality improvements than an internal team splitting attention across model development and operational maintenance.
Sentient Concepts operates end-to-end AI programmes for enterprise clients in finance, manufacturing, logistics, and insurance, maintaining accountability across strategy, engineering, and managed operations without the handoffs that typically break the production→development loop. For teams assessing their AI readiness before committing to an observability architecture, that continuity of ownership is a meaningful operational advantage.
Key takeaways
Effective LLM observability requires full-chain tracing, semantic evaluation, and a closed production-to-development feedback loop — infrastructure metrics alone will not detect the failure modes that matter most in production.
Point | Details |
Instrument full-chain traces first | Capture every span from user input through retrieval, prompt assembly, generation, and tool calls using OpenTelemetry. |
Measure semantic quality, not just uptime | Score outputs for hallucination, faithfulness, and relevance using auxiliary evaluation models alongside standard latency and token metrics. |
Close the production→development loop | Automatically curate failed traces into eval datasets and gate deployments on evaluation results via CI pipelines. |
Address UK data residency early | Confirm trace and payload storage jurisdiction before selecting a platform; UK GDPR applies to prompts and outputs containing PII. |
Sentient Concepts for managed operations | Sentient Concepts delivers end-to-end observability programmes including instrumentation, eval pipelines, and UK-compliant managed operations for enterprise AI teams. |
What most teams get wrong about LLM observability
The gap between what observability promises and what most teams actually extract from it is wider than it should be. The instrumentation is rarely the hard part. Teams stand up OpenTelemetry collectors, route traces to Grafana, and declare the work done. What they have built at that point is a monitoring dashboard, not an observability practice.
The distinction matters operationally. A dashboard tells you that something went wrong. Observability tells you why, and more importantly, it gives you the mechanism to prevent the same failure from recurring. That mechanism is the production→development loop, and it is the part that almost every team underestimates.
Eval maintenance is the hidden cost. Automated LLM-as-judge pipelines feel like a solved problem when you first configure them. Six months later, the judge model has drifted, the prompt templates have changed, and the scores no longer correlate with what domain experts consider a good answer. Without scheduled human calibration sessions, automated evals quietly become unreliable, and the quality signals that engineering and product teams rely on become misleading.
Cross-functional collaboration is the other underestimated factor. Engineers instrument the traces; product managers and domain subject matter experts are the people who can actually interpret whether a flagged output represents a real quality failure or an acceptable edge case. Observability that only engineers can access produces observability that only engineers act on, which limits its commercial impact considerably. The teams that extract the most value from large language model monitoring are the ones that make trace review and eval annotation accessible to QA analysts, domain experts, and product owners, not just ML engineers.
The final lesson is about scope. Starting with a single high-value use case and closing the full loop, from instrumentation through eval to prompt improvement and CI gating, is worth more than broad shallow coverage across an entire application. One well-instrumented pipeline with a functioning feedback loop teaches you more about your system’s failure modes than ten dashboards with no downstream action.
Sentient Concepts accelerates observability adoption for enterprise AI teams
Enterprise AI teams that have built production LLM pipelines often reach the same point: traces are flowing, dashboards are live, and yet quality regressions still reach users because no one owns the loop from flagged trace to fixed prompt to validated deployment. That gap is precisely where Sentient Concepts operates.
Sentient Concepts delivers end-to-end AI programmes that include instrumentation design, evaluation pipeline engineering, runbook development, and managed AI operations with defined SLAs, covering the full cycle from PoC to production. For UK enterprise clients in finance, insurance, manufacturing, and logistics, Sentient Concepts provides UK data residency options and operates observability infrastructure within the compliance boundaries those sectors require. The data and platform engineering practice builds the telemetry and storage layers that underpin reliable, long-term observability. If your team needs a partner who will own the production→development loop rather than hand it back to an already stretched engineering function, speak with Sentient Concepts about a scoped engagement.
Useful sources
Source | What it covers | Best used for |
OpenTelemetry: LLM observability with OpenTelemetry | Auto-instrumentation of LLM providers and vector DBs; OTLP export to Prometheus, Grafana, Jaeger | First read for any team starting instrumentation; covers OpenLIT/OpenLLMetry setup |
Comet: LLM observability ultimate guide | Semantic evaluation, production→development loop, dataset management, eval frameworks | Core reference for eval pipeline design and understanding the full observability lifecycle |
Datadog: What is LLM observability and monitoring? | Feature checklist: chain debugging, hallucination detection, prompt injection, full-stack visibility | Useful for vendor evaluation and understanding enterprise feature expectations |
Splunk: LLM monitoring — the whys and hows | Metrics catalogue: compute per token, perplexity, BLEU/ROUGE, factuality, user-experience signals | Metrics reference for dashboard and alert design |
AWS: Techniques for monitoring LLMs on AWS | Agentic monitoring, black-box limitations, LLM-as-judge calibration guidance | Architectural guidance for agentic workloads and cloud-hosted deployments |
Traceloop/OpenLLMetry on GitHub | Open-source instrumentation for LLM APIs and vector DBs; OTLP export without vendor lock-in | Clone this repository to start a reproducible PoC; integrates with existing backends |
Open-source RAG triad evaluation: context relevance, groundedness, answer relevance | Evaluation framework for RAG pipelines; pairs well with OpenTelemetry tracing |
FAQ
What is observability in LLM?
LLM observability is the practice of instrumenting, tracing, and evaluating large language model systems to make their semantic behaviour measurable in production. Unlike traditional observability, it covers not just latency and errors but also hallucination rates, faithfulness to source documents, and retrieval quality.
What are the pillars of LLM observability?
The core pillars are tracing and spans, metrics and telemetry, semantic evaluation, dataset and metadata management, and agent observability. Together they provide visibility into both the computational and semantic behaviour of a production LLM system.
What is the best LLM observability platform?
The right platform depends on your workload. Specialised platforms offer deeper agentic debugging and native eval frameworks, while general APM platforms such as Datadog provide unified infrastructure and LLM visibility in a single stack. For teams that need full-chain trace visibility and built-in evaluation, a specialised platform or an open-source stack built on OpenTelemetry and TruLens is typically the stronger choice.
What are the four pillars of observability?
Traditional observability is built on logs, metrics, traces, and (increasingly) events. LLM observability extends this foundation by adding a fifth pillar, semantic evaluation, because HTTP-level signals cannot detect factually incorrect or contextually irrelevant model outputs.
Recommended